Building teams
Team skill radar
At our The Strategy Unit Data Science team (SUDS 🧼) away day, I ran a short session reflecting on the skills of the team, both as individuals and as a whole.
It was intended as a short fun activity to get us up and moving and after a lot of technical meetings rather than a serious skills matrix. However, it started some valuable discussions so you might find it helpful to use. Feel free to borrow / adapt this idea for your own sessions.
I chose the following categories based on the Mango data science radar1, but you can choose any that make sense for your team
- Communicator
- Visualiser
- Technlogist
- Programmer
- Modeller
- Data Wrangler
I gave out a blank skills “spider web”/radar chart, with 6 common data science skills. Each data scientist secretly scored themselves between 1 and 7.
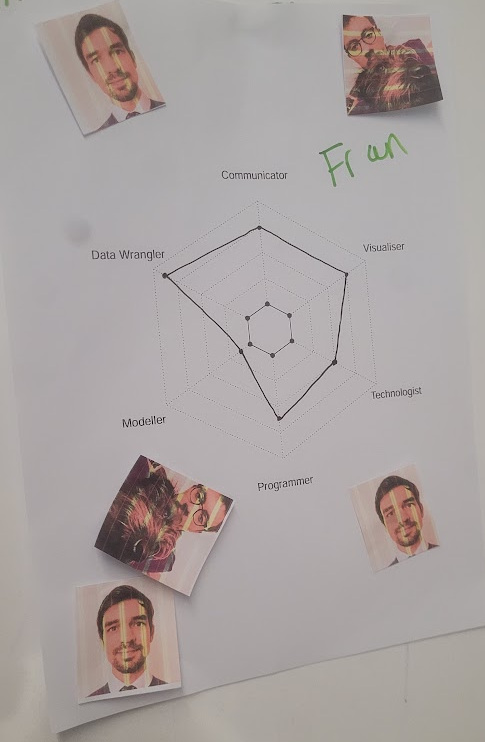
I hung the anonymous radars on the wall, and we had to match the radar to the data scientist. We did this by sticking a photo of their face 2 on the radar we thought belonged to them. It was interesting to see commonalities across team members and also to see the strengths and breadth across the team.
Once all guesses were made, I did the reveal one radar at a time, getting the person to talk through their strengths / enjoyments
We looked at the similarities (for example people often confused me with YiWen as we both like communicating)
I averaged across the team for each skill and drew a “team level” radar.
Below are some of the team’s radars, and who we guessed they belonged to.
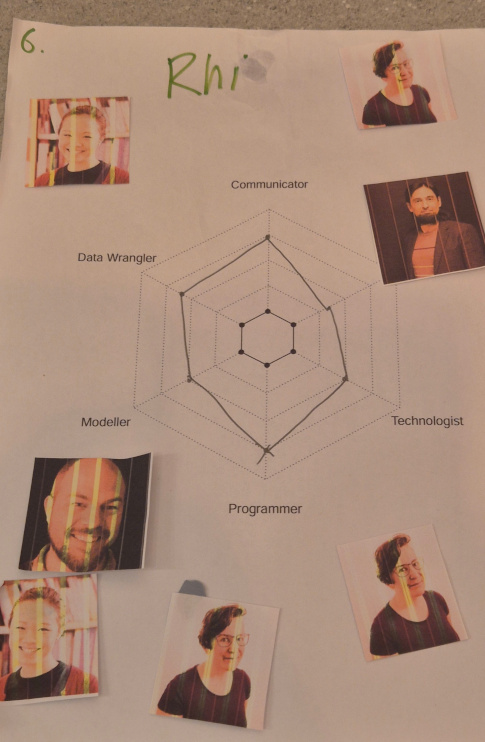
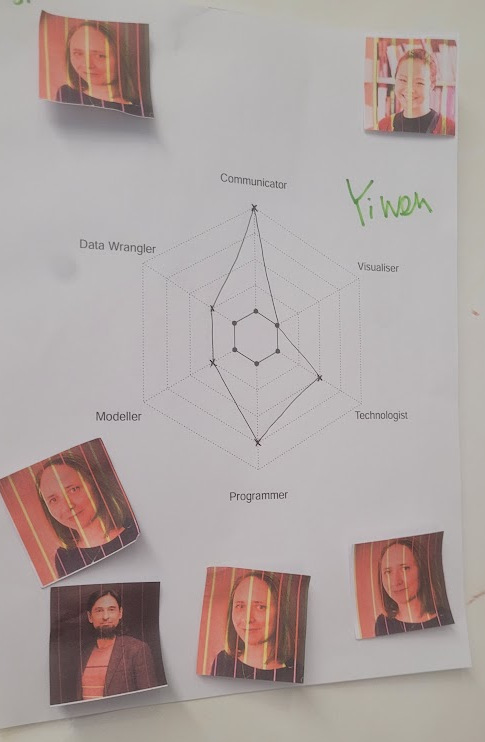
Three people corrected guessed my radar. Being strong in communication made other team members think it was YiWen (who I do share skill similarities with).
No one guessed that Fran’s radar belonged to him, probably because Fran was brand new to the team and people hadn’t got to know him and his skills3 yet.
You can download a PDF of a blank radar chart, and the R code I used to generate it (using the {fmsb} package).
skills <- c("Communicator", "Technologist", "Programmer",
          "Modeller", "Data Wrangler", "Visualiser")

n_levels <- 7
n_skills <- length(skills)

data <- as.data.frame(matrix(c(rep(n_levels, n_skills),
                               rep(0, n_skills),
                               rep(NA, n_skills)),
                             byrow = TRUE, nrow = 3))
colnames(data) <- skills
rownames(data) <- c("max", "min", "values")

fmsb::radarchart(data, seg = n_levels,
           vlcex      = 0.9, # size of the axis label text
           cglcol = "grey60" # colour of the lines
)
MDT for data
As data teams We’re too isolated.
MDT’s are a thing in healthcare a team working together
Data scientists sometimes hate data 😲
The value of having great analysts, sense-checkers and pipeline people
Everyone has different views based on where they sit (and what their history is)
Could work with the DS game
The uber skill is finding where your blindspots are and surrounding yourself with people who cover those In the 70s you could do it all, now varied teams are essential What are the impacts on career progression? What are the boundaries and overlaps We saw this with BI vs analysts Justine’s title has changed over the years